3 Results and Discussion
3.1 Economical Aspects of Nuclear Power Plants
Building costs of nuclear power plants in the U.S.
In fig. 2 the overnight costs6 of already build and estimated overnight / total costs of future nuclear reactors in the U.S. can be seen.
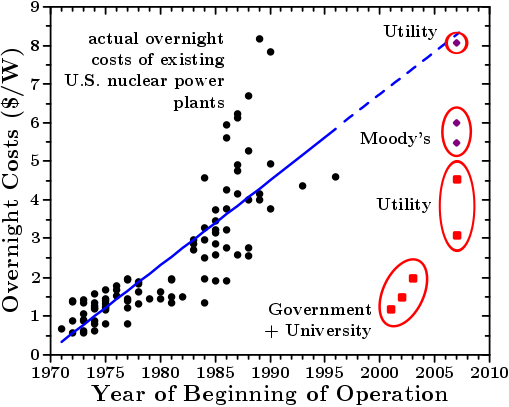
Fig. 2: Costs for nuclear power plants. Black dots: actual overnight costs of existing U.S. plants in 2004 Dollar. Red squares / purple diamonds: overnight costs / total costs of future plants estimated by different actors (in dollar value of the respective year). Due to the vicinity to 2004, the value of these was not adjusted for inflation. Data taken from [24, 21, 25]. Blue solid / dashed line: linear regression / extrapolation of the historical data.
The black dots in fig. 2 represent the actual overnight costs of up and running reactors in the United States. These costs were steadily rising over the periode of heavy construction of nuclear power plants in the 70’s and 80’s. The coloured dots in fig. 2 are estimations of the costs of new plants. As one can see are the estimations of independent actors, or the companies that actually have to take the risks, considerable higher then that of government officials und academics. If one simply extrapolates the historical data one comes to the same conclusion as one utility regarding the building costs of a new nuclear reactor. Thus for a 1 GW plant the estimated construction costs sum up to more then 10 Billion $.
This already is a considerable financial burden even for large companies. However, the coloured points in fig. 2 are just cost estimations. In fig. 3 the averaged estimated costs before construction started and realized overnight costs of the U.S. nuclear reactors that were up and running (or finished to 90 %) in 19867 can be seen.
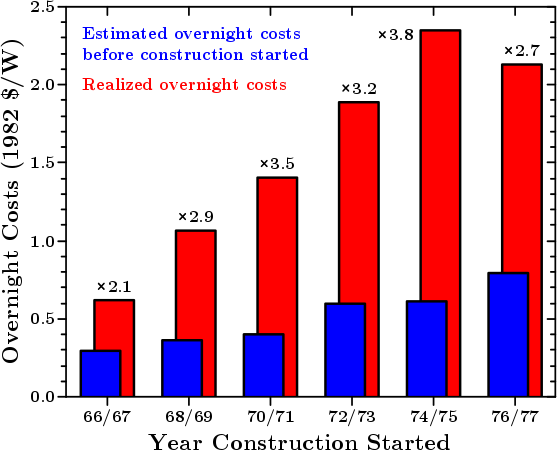
Fig. 3: Estimated and realized overnight costs of most of the U.S. Nuclear Power Plants that make up the data embodied in the black dots in fig. 2. Data taken from [26].
As one can see, are the realized overnight costs on average thrice as much as the estimated overnight costs. On top of that up to 30.7 % (on average 23.5 %) of the already high realized overnight costs had to be paid due to time related factors8 [26].
Cancellation of nuclear power plants in the U.S.
So far just data from nuclear power plants that were actually realized has been presented. In fig. 4 is shown how many units9 were started and how many got cancelled each year.
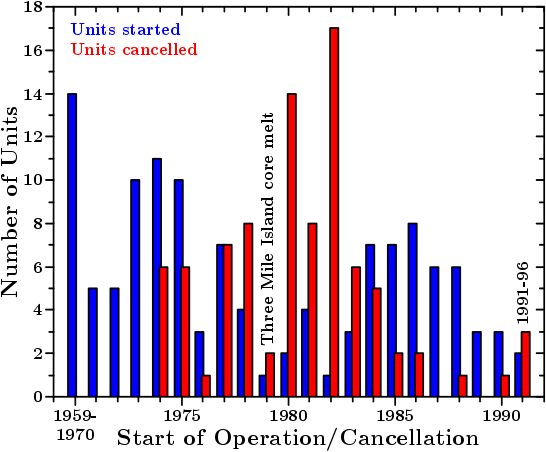
Fig. 4: Finished and cancelled nuclear reactor units per year in the U.S. Due to the small number of reactors started before 1971 these are summarized in the first bar. Dito for the last bar for the reactors finished/cancelled 1991-1996. Data taken from [22, 21, 18].
During the periode of heavy nuclear reactor construction in the U.S. (mainly between 1970 and 1990) 122 reactor units started operation and 89 untis got cancelled. From that could be concluded that after a couple of years of experience with nuclear reactors, utilities did not any longer want to take the risks of constructing/operating such a kind of power plant.
Also the data in fig. 4 may suggest that many reactors got cancelled due to „environmental alarmism“, and not well thought through calculations, since many cancellations took place after the core melt at the Three Mile Island plant.
However, this hypotheses can be rejected if one looks upon the development of finished / cancelled units with respect to when their construction permits were issued. This is shown in fig. 5.
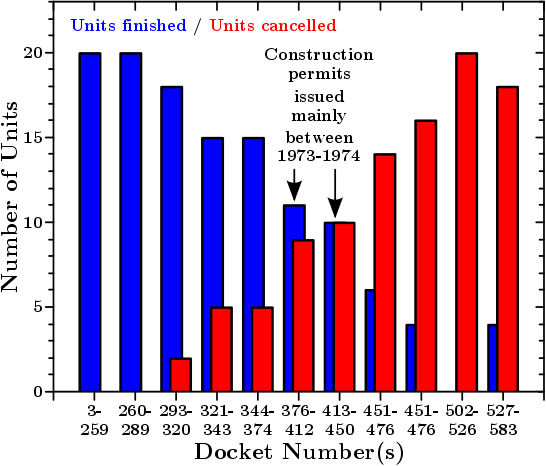
Fig. 5: Nuclear reactor projects which got a construction permit that were finally finished or terminated (cf. text).
Just for the reactors that started operation, the construction date, or the date when the construction permit was issued, is given in the cited sources. Since for all the cancelled reactors this information is missing, the docket numbers of these projects act as a timeline in this figure.10
The construction permit for all (or the vast majority) of the units behind these docket numbers were issued well before the Three Mile island core melt. For the realized plants construction started usually the day after the permit was issued. It seems valid to assume that this happened also for the power plants that were not finished.
What this picture shows is the following: even though the construction of many nuclear power plants was cancelled after the core melt in the Three Mile Island reactor, all these projects have already been for many years under way at the time of this incident. So the involved owners of these projects had ample time to (re)evaluate the risks and possibilities involved in such a project and many came to the conclusion that these risks are finally not worth taking. The core melt at Three Mile Island happened to be around the same time of such re-evaluations and ecological/sociological issues may have come in addition to the economic concerns which eventually lead to the abortion of almost half of all nuclear power plant projects.
Some concrete examples in how far cost escalations, and thus economically non-sustainability, lead to the abortion of nuclear power plant projects, even at very advanced stages, can be found in [27].
Operation and maintenance costs of nuclear power plants
Since the building costs (and the escalation of these) were considered to be a decisive factor for a utility to carry out the construction (or cancellation) of a nuclear power plant, these were considered in the previous sections. But when a nuclear power plant gets finished, come operation, maintenance and fuel costs in addition.
As shown in fig. 6 are the costs for maintaining and operating a nuclear reactor approximately double as high as for other kinds of plants.11
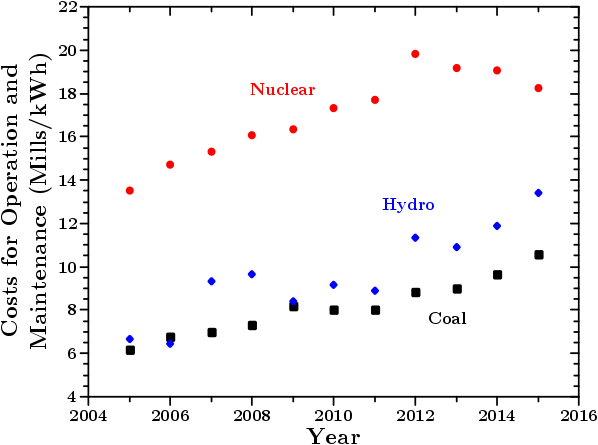
Fig. 6: Operation and maintenance costs for different types of electricity generating plants. A mill is a unit equal to one tenth of a U.S. cent. Data taken from table 8.4 in [32].
Since this is again data from the U.S., it may be speculated in how far the higher costs of nuclear power plants are due to the age of these plants. However, the development of the costs over the past decade are the same for all types of power plants and not significantly steeper for the nuclear type. Thus it may be concluded that higher costs due to older plants seem not to play such an important role. In fig. 6 the costs for fuel are excluded, since historically the low price for nuclear fuel was the area in which this kind of electricity generation could outcompete all other types. With electricity generation by utilizing the sun or wind on the rise [33] this argument becomes obsolete, because the price for these two „fuels“ is zero.
The costs for nuclear fuel
As Great Britains department of trade and industry points out in [34] are „the potential benefits of new nuclear build[s] […] naturally dependent on the availability of fuel“ and since the fuel costs are considered to be one of the main advantages of nuclear power plants these shall be briefly contemplated. According to the IAEA/NEA Report „Uranium 2016: Resources, Production and Demand“ [35]12 were in 2014 worldwide 437 nuclear reactors online. These had a total electrical generating capacity of 377.4 GW and required 56585 tons of Uranium as fuel.13
In fig. 7 the worlds recoverable, conventional, reasonably assured and inferred uranium ressources (as of 2014) can be seen in dependency of the costs needed to recover them.
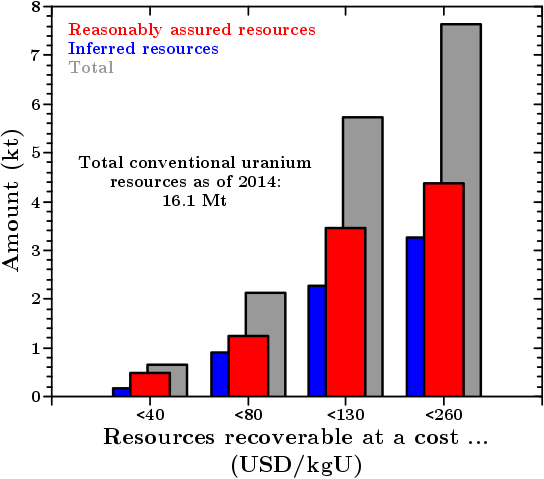
fig. 7: Recoverable world uranium resources as of 2014. Data taken from Table 1.1 in [35].
The total of 16.1 Million tons of recoverable uranium would last for ca. 285 years, if the demand remains constant at the 2014 value. However, with the above mentioned 1000-1500 reactors14 that should be build so that nuclear power is supposed to have a positive influence onto GHG emissions, this amount of uranium would last for just 125-85 years.15
So this simple calculation shows that nuclear power is certainly not a long term solution and even the aforementioned James Lovelock agress with those numbers and the conclusion [36]. Probably not even a mid-term solution, because, as oil, the nuclear fuel is limited and scarcity of a resource leads to a price increase, independent of the actual recovery costs.
One could argue that more then 4 billion tons of uranium are dissolved in the worlds oceans and can principally be recovered, albeit at much higher costs [35]. Such an amount would last long enough to make nuclear power a long term solution. But the higher price of the fuel will then have to be taken into account regarding the economic sustainability of uclear power.
In fig. 6 the fuel costs for operating U.S. reactors are not included, due to the low prices for nuclear fuel, compared to coal or gas. These however, can be seen in fig. 8 together with the (average) spot price for uranium according to the Euratom Supply Agency.
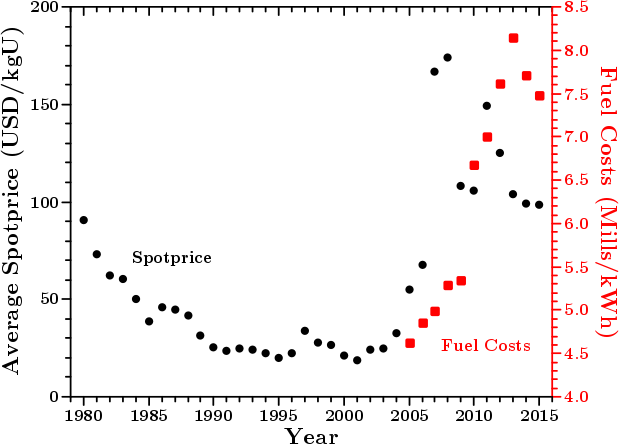
Fig. 8: Black dots: ESA average uranium prices; red squares: average fuel costs for commercial U.S. power plants. Data taken from [37] and [32].
As one can see in fig. 8 was the price for Uranium in the last 10 years approximately a factor of five higher then the two decades before. If a trend persists since a decade, one can probably assume that it is not to be temporary but permanentely. From the prices in fig. 8 one may assume that the industry started mining the <130 USD/kgU-resources wile the remaining more profitable resources still keep the price from rising even higher. As was to be expected are the average fuel costs (red dots in fig. 8) correlated to the uranium price. While the fuel costs are still just one quarter of the costs for coal or gas power plants [32]16 lately the fuel costs make up half of the running costs of a nuclear power plant.
This may make electricty generation by nuclear power economically even less attractive then by just taking the extremely high initial costs and the twice as high operation and maintenance costs (compared to other types of conventional power plants) into account. This will get even worse when the uranium prices rise further, once the more profitable resources are exhausted.
Other economical issues in connection with nuclear power
Below I’d like to briefly mention more, economically relevant, issues that were not included in the above detailed analysis.
- The rise of the building costs took place during a periode in which very many nuclear power plants were build in the U.S. (cf. fig. 2 and fig. 3). In such a scenario, rising construction costs are contradictory to the capitalist dogma that „demand creates supply and thus falling prices“. Spanning two decades, this periode can’t be considered short term. Either the capitalistic system is fundamentally broken or nuclear power does simply not work in it. In addition comes that since that periode more then two decades have past and most likely a consolidation of the (construction) material supply chain and skilled workers took place. Thus the construction costs of new nuclear power plants may be even higher then already anticipated, due to limited supply.
- Externalities like waste management or the costs of large scale accidents are usually taken care of by society and not the private firms operating the plants.
- Apart from this, at least the U.S. government actively makes more of such incentives available [38]. However an even wider range of nuclear power plant related issues are heavily subsidized. A detailed analysis of such subsidies can be found in [39]. As Koplow writes: „[t]hese subsidies […] enabled the […] reactors to be built in the first place, but have also supported their operation for decades“. Even the low-end estimate for subsidies „represents nearly 80 percent of the production-cost advantage of nuclear relative to coal.“
Under these circumstances, the claim of Brook et al. [14] and many other nuclear power proponents, that one condition regarding the „economic viability of nuclear energy“ must be „[the] presence of a ‚level playing field‘, i.e. an open market that is not skewed in favor of some technologies by means of subsidies“, seems to be build on sand.
All of this makes nuclear energy economically unsustainable and from a „market point of view“ it should not be considered as a „climate saving technology“.
3.2 The Prospects of GHG Emission Reduction With Nuclear Power
According to the World Energy Council will by 2050 at least twice as much electricity generated worldwide [40]. That means that the proposed 1000 new nuclear power plants17 are barely enough to keep the share of electricity generated by nuclear power at the same level as of today. If nuclear power really shall have a meaningful contribution towards the reduction of GHG emissions, probably even 2000 new nuclear reactors are too low a number to achieve that goal. The point is, that very many new reactors have to be build and operated. While nuclear energy proponents claim that this type of energy is „emission free“, this is far from true.18 Over the whole life cycle of a nuclear power plant a non-neglectable amount of green house gasses is emitted. Sovacool performed in [45] a meta-analysis of the existing lifecycle studies and comes to the conclusion that on average a nuclear power plant emits ca. 66 g CO2 equivalents per kWh. While this is approximately seven to 15 times less [46] then directly burning fossil fuels, it has to be taken into account, that in the past easy recoverable nuclear fuel was used. Among other things that means that the uranium content in the mined ore was relatively high, e.g. 1.5 % as in the study by Andseta et al. [47]19. However, fig. 9 shows that the remaining (conventional) uranium reserves are contained in ore with much lower uranium content20.
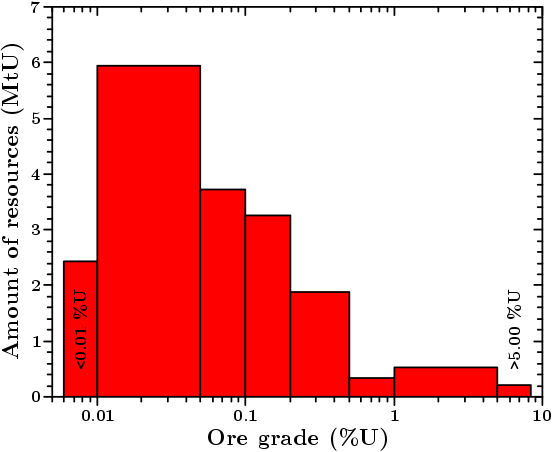
Fig. 9: Upper estimated amount of uranium ressources in dependency from the ore grade. The width of the bars shall just visualize the given range of ore grade and is not representative for the amount of resources. Daten taken from the IAEA’s World Distribution of Uranium Deposits Database (UDEPO) [48].
Since the abscissa in fig. 9 has a logarithmic scale it can easily be seen that the remaining resources are embedded in ore with a uranium content at least several times less then in the ore that was used for nuclear fuel up until now. Actually the majority of the not recovered ore contains uranium to an extent of approximately just one hundreth of the value of the past.
Already now, the mining, milling, converting, enriching and fabrication of the nuclear fuel21, makes on average up almost 40 % of the emission of greenhouse gasses of nuclear power plants [45]. With a hundredfold smaller uranium content, it is to expect that in the steps to create nuclear fuel both the energy required and the direct emission of greenhouse gasses (e.g. due to mine wastes) may rise tremendously.
Taking these facts into account makes nuclear power even less to be considered as an honest option to significantly reduce GHG emission. This is especially the case since the „quality“ of solar radiation or the wind are unlikely to deteriorate.
3.3 The Social Sustainability of Nuclear Power
- The proliferation of nuclear weapons: Nobel laureate Hannes Alfvén said „Atoms for peace and atoms for war are Siamese twins“22. This quote captures the dual-use nature of technologies that produce nuclear fuel. However, as written above, the wish to own nuclear weapons is a valid reason for nuclear power, regardless its sustainability either economical, ecological or social.
- Large scale desasters: After the core melt of unit 4 of the Chernobyl nuclear power plants, with its catastrophic consequences, one of the main discussion points of nuclear power advocates was, that such an accident could never happen with western technology and operations standards; or in short that „our reactors are safe“ (see e.g. [51]). The core melts of units 1 to 3 of the Fukushima Dai-ichi nuclear power plant with the subsequent release of nuclear material [52] have shown that this assurance is quite hollow. Or as Lelieveld et al. put it in [53]: „[…] based on the evidence over the past decades one may conclude that the combined probabilities […] [of a core melt and subsequent containment failure] have been underestimated“. It is hard to imagine that the unsettling events for hundreds of thousands of humans, caused by the (often permanent) evacuation after such events; the rendering of large areas to be uninhabitable and not usable for agriculture for decades; costs in the range of hundreds of billions of dollars paid by the public23; and the fear invoked in the general population after such desasters are desirable.
- Non-public awareness of regular incidents at nuclear power plants: The Guardian lists 34 nuclear power plant accidents and incidents since 1952 [54]. The general public is somewhat aware of two of them, the core melts at the Chernobyl and Fukushima nuclear power plants. The Three Mile Island, Windscale and Sellafield accidents are barely present in the public mind. However, this is just the visible tip of the iceberg since these accidents and incidents had major consequences. The U.S. NRC Information Digest [18] lists for 2014 and 99 U.S. nuclear reactors the following average numbers.24
- Unplanned automatic scrams25 per plant while the reactor was critical: 39.
- Number of times a reactor had to shut down because of equipment failures: ca. 70.26
- Number of safety system actuations27: 20.
- Number of safety system failures28: 84.
- And last but not least the number of significant events29: 3.
Accidents happen also in coal power plants, with windturbines and in everyday life. And the occurance of nuclear power related direct fatal casualties30 may be low compared to deaths caused by air pollution due to coal power plants [14]. However, as discussed above, the wider consequences of large scale nuclear accidents are unfathomable. Also it is a fact of life that small incidents can either by chance or due to neglect, easily develop into desasters31. Thus it is bewildering that the number of such smaller incidents is not at all present in the discussion regarding nuclear power.
All of the here stated numbers and reasons show in my opinion the social non-sustainability of nuclear power and are probably the main reasons for many people to become or be opponents of nuclear power.
Footnotes
- 6. The overnight costs contain all capital costs as if the plant was build over night. In reality this is not the case and interest has to be paid, so the real costs are even higher. Naturally these values don’t contain running, fuel or decommissioning costs. ↩
- 7. These make up the majority of the black dots in fig. 2. ↩
- 8. Increasing relative prices and financing charges during the building period. ↩
- 9. A unit is a nuclear reactor, one plant can have several units. ↩
- 10. Albeit this could be checked just for the reactors that started operation, this assumption is true at least for these (with very few exceptions) and the generalization seems to be valid. ↩
- 11. Operation and maintenance costs of solar photovoltaic systems and on- or offshore windturbines are not included in fig. 6 since „[…] there is still a significant degree of commercial sensitivity surrounding operational performance and limited data in the public domain“ as Carroll et al. write in [28]. If data is available a frequent problem is the inconsistency of the database (e.g. if land lease or insurence is included or not in the operating costs).
For on-shore windturbines Wiser et al. present in [29] operation and maintenance costs of 34 mills/kWh, 24 mills/kWh, 10 mills/kWh and 9 mills/kWh for windturbines constructed in the U.S. respectively in the eigthies, nineties, noughties and since 2010.
Carroll et al. calculate for off-shore windturbines operation and maintenance costs between 22-38 mills/kWh, 25-42 mills/kWh and 53-78 mills/kWh for windturbines respectively 10 km, 50 km and 100 km away from land. Approximately 90 % of these costs are in all cases due to lost production and transport to the windturbines [28]. This however, is a problem that can partly be solved when permanently occupied maintenance crew habitats become sustainable, once the off-shore wind-turbine fields become large enough. In [30] Gonzalez-Rodriguez reports 10-31 mills/kWh for the operation and mainenance costs for off-shore windturbines, compiled from different sources.
It is harder to come by the costs for solar photovoltaic systems. The International Renewable Energy Agency presents in [31] the levelised costs of electricity (LCOE) of solar photovoltaics. These have been falling drastically in the past years due to much lower solar panel prices. However, the LCOE are by no means a measure for the operation and maintenance costs of such systems which are stated in the same report to be between 20 % to 45 % for solar photovoltaics in Europe. From the figures given for the LCOE in Europe (between approx. 100-200 mills/kWh) one can calculate that the operation and maintenance costs for solar photovoltaic systems are between 20-90 mills/kWh.
These numbers show that the operation and maintenance costs of renewable energy systems are already comparable with nuclear power. Considering that the wide employment of these technologies is a rather new development, and taking into account foreseeable improvements and cost reductions due to mass production and other economic mechanisms, a radiant future of renewable energy can be considered. ↩ - 12. Table 2.1. Nuclear data summary ↩
- 13. See [35] for a possible explanation regarding the discrepancy of one reactor as stated in [18]. For the purpose of this report this difference does not matter and is not further considered. ↩
- 14. Or the more realistic 1150-1750 reactors, if one calculates according to the „to be installed“ capacity. ↩
- 15. Or 110-50 years, with 1150-1750 reactors respectively. ↩
- 16. This is valid for the historically low prices for gas. Time will show if these are sustainable. ↩
- 17. Half of these have to replace old, decomissioned ones. ↩
- 18. The GHG emissions of renewable energy sources shall not be discussed here, but can be found e.g. in [41, 42, 43, 44]. ↩
- 19. [47] is an updated paper of the source cited in [45]. However, it is assumed that the amount of uranium in the ore from the canadian mines, which were used as references for the study, has not changed. ↩
- 20. Of the estimated resource range given for one deposit/mine, the upper limit was used for the numbers in fig. 9. If the resource range was stated as ‚larger than 100.000 t‘ it was taken into account as 100.000 t. Deposits/mines with missing data were not included. The slight difference in the absolute amount of resources compared to fig. 7 and given in [35] may be due to more up to date data in [48]. ↩
- 21. The so called ‚Frontend‘ of the nuclear life cycle. ↩
- 22. Cited in [49], earliest reference for this quote (however, not attributed directly to Alfvén) was found in [50]. ↩
- 23. In the U.S. the owner of a nuclear power plant needs to purchase an insurance that has to cover not more then 300 million USD. If the damage adds up to not more then 10 billion USD, the costs will be shared between the owners of all U.S. nuclear power plants. [38] However, a catastrophy like Fukushima or Chernobyl have costs very much higher then 10 billion USD. ↩
- 24. Appendix H, Industry Performance Indicators : Industry Averages, FYs 2006–2015. The document does not clearly distinguish between a nuclear power plant that may have several reactors and the reactor units themself. The numbers presented here are calculated as if the figures presented in [18] are per nuclear reactor. ↩
- 25. According to [18] is a scram „[t]he sudden shutting down of a nuclear reactor by the rapid insertion of control rods“. ↩
- 26. This number is somewhat obscured in a figure called ‚equipment forced outage rate per 1000 commercial critical Hours‘. The reactors in the U.S. have a capacity factor of approximately 90 %. While this can not simply be seen as the number of hours a reactor is running it can reasonably be assumed that on average the U.S. reactors are delivering electricity to the grid 7000 hours per year. With the 99 reactors operating in the U.S. the here stated number was derived. ↩
- 27. ‚[…] certain manual or automatic actions taken to start emergency core cooling systems or emergency power systems. These systems are specifically designed to either remove heat from the reactor fuel rods if the normal core cooling system fails or to provide emergency electrical power if the normal electrical systems fail.‘ [18] ↩
- 28. ‚[…] [A]ctual failures, events, or conditions that could prevent a system from performing its required safety function.‘ [18] ↩
- 29. ‚[…] [F]or example, degradation of safety equipment, a sudden reactor shutdown with complications, or an unexpected response to a sudden degradation of fuel or pressure boundaries.‘ [18] ↩
- 30. Probably even death cases because of cancer due to the exposure to radioactivity released by such accidents. ↩
- 31. For example could the wrong type of oil (a very minor incident) for an emergency power diesel generator lead to the early failure of the same when it is a necessity that it is functioning and as a consequence the cooling water flow to the reactor may fail. ↩
References
- [14] B. W. Brook et al., „Why nuclear energy is sustainable and has to be part of the energy mix“, Sustainable Materials and Technologies, vol. 1-2, pp. 8–16, 2014. ↩ ↩
- [18] U.S. Nuclear Regulatory Commission, „Information Digest 2016-2017, NUREG-1350“, vol. 28, 2016. ↩ ↩ ↩ ↩ ↩ ↩ ↩ ↩
- [21] J. Koomey and N. E. Hultman, „Electronic Annex for A reactor-level analysis of busbar costs for US nuclear plants, 1970–2005“, Energy Policy, vol. 35, pp. 5630–5642, 2007. ↩ ↩
- [22] F. A. Heddleson, „Summary Data for U.S. Commercial Nuclear Power Plants in the United States – ORNL/NUREG/NSIC-141“, U.S. Nuclear Regulatory Comission – Office of Nuclear Regulatory Research, tech. rep., 1978. ↩
- [24] T. McConnell et al., „A Roadmap to Deploy New Nuclear Power Plants in the United States by 2010“ (Vol. I, Vol. II), United States Department of Energy, Office of Nuclear Energy, Science and Technology and its Nuclear Energy Research Advisory Committee Subcommitte on Generation IV Technology Planning, tech. rep., 2001. ↩
- [25] D. Schlissel and B. Biewald, „Nuclear Power Plant Construction Costs“, Synapse Energy Economics, Inc., 2008. ↩
- [26] Energy Information Administration, „An Analysis of Nuclear Power Plant Construction Costs – DOE / EIA-0485“, U.S. Department of Energy, tech. rep., 1986. ↩ ↩
- [27] S. Maloney, „A Critical Examination of Nuclear Power`s Costs“, chapter 2 in „The Future of Nuclear Power in the United States“, pp. 32–45. Federation of American Scientists, Washington and Lee University, 2012. ↩
- [28] J. Carroll et al., „Availability, operation and maintenance costs of offshore wind turbines with different drive train configurations“, Wind Energy, vol. 20, pp. 361–378, 2017. ↩ ↩
- [29] R. Wiser et al., „2014 Wind Technologie Market Report“, U.S. Department of Energy, 2015. ↩
- [30] A. G. Gonzalez-Rodriguez, „Review of offshore wind farm cost components“, Energy for Sustainable Development, vol. 37, pp. 10–19, 2017. ↩
- [31] Michael Taylor, Pablo Ralon, and Andrei Ilas, „The Power to Change: Solar and Wind Cost Reduction Potential to 2025“, International Renewable Energy Agency, 2016. ↩
- [32] U.S. Energy Information Administration, „Electric Power Annual 2015“, 2016 ↩ ↩ ↩
- [33] J. Johnson, „Renewables rise globally, coal sees sharp decline (Note)“, Chemical and Engineering News, vol. 94, no. 46, p. 17, 2016. ↩
- [34] Department of Trade and Industry, „The Energy Challenge – Energy Review Report 2006“, TSO (The Stationery Office), 2006. ↩
- [35] Nuclear Energy Agency and International Atomic Energy Agency, „Uranium 2016: Resources, Production and Demand“, tech. rep., 2016. ↩ ↩ ↩ ↩ ↩ ↩ ↩
- [36] D. Aitkenhead, „Saturday Interview James Lovelock: Before the end of this century, robots will have taken over“, The Guardian, 2016-09-30 (accessed 2017-07-20) ↩
- [37] Euratom Supply Agency, „ESA average uranium prices“, 2017, (accessed 2017-07-20). ↩
- [38] Congressional Budget Office, „Nuclear Power`s Role in Generating Electricity“, Congress of the United States, 2008. ↩ ↩
- [39] D. Koplow, „Nuclear Power: Still Not Viable without Subsidies“, Union of Concerned Scientists, 2011. ↩
- [40] World Energy Council, „World Energy Scenarios: Composing energy futures to 2050“, 2013. ↩
- [41] M. Pehnt, „Dynamic life cycle assessment (LCA) of renewable energy technologies“, Renewable Energy, vol. 31, pp. 55–71, 2006. ↩
- [42] J. Peng, L. Lu, and H. Yang, „Review on life cycle assessment of energy payback and greenhouse gas emission of solar photovoltaic systems“, Renewable and Sustainable Energy Reviews, vol. 19, pp. 255–274, 2013. ↩
- [43] J. K. Kaldellis and D. Apostolou, „Life cycle energy and carbon footprint of offshore wind energy. Comparison with onshore counterpart“, Renewable Energy, vol. 108, pp. 72–84, 2017. ↩
- [44] A. Kadiyala, R. Kommalapati, and Z. Huque, „Characterization of the life cycle greenhouse gas emissions from wind electricity generation systems“, International Journal of Energy and Environmental Engineering, pp. 55–64, 2017. ↩
- [45] B. K. Sovacool, „Valuing the greenhouse gas emissions from nuclear power: A critical survey“, Energy Policy, vol. 36, pp. 2950–2963, 2008. ↩ ↩ ↩
- [46] L. Gagnon, C. Bélanger, and Y. Uchiyama, „Life-cycle assessment of electricity generation options: The status of research in year 2001“, Energy Policy, vol. 30, pp. 1267–1278, 2002. ↩
- [47] S. Andseta et al., „CANDU Reactors and Greenhouse Gas Emissions“, Canadian Nuclear Association, 1998. ↩ ↩
- [48] I. A. E. Agency, „World Distribution of Uranium Deposits Database (UDEPO)“, 2017. ↩ ↩
- [49] A. Shlyakhter, K. Stadie, and R. Wilson, „Constraints Limiting the Expansion of Nuclear Energy“, Harvard University, Department of Physics, 1995. ↩
- [50] M. Kenward, „West Germany encourages nuclear debate“, New Scientist, vol. 70, no. 3, pp. 521–523, 1976. ↩
- [51] Gesellschaft für Anlagen- und Reaktorsicherheit (GRS) mbH, „Tschernobyl – Zehn Jahre danach: Der Unfall und die Sicherheit der RBMK-Anlagen“, tech. rep., 1996. ↩
- [52] A. Stohl et al., „Xenon-133 and caesium-137 releases into the atmosphere from the Fukushima Dai-ichi nuclear power plant: determination of the source term, atmospheric dispersion, and deposition“, Atmospheric Chemistry and Physics, vol. 12, pp. 2313–2343, 2012. ↩
- [53] J. Lelieveld, D. Kunkel, and M. G. Lawrence, „Global risk of radioactive fallout after major nuclear reactor accidents“, Atmospheric Chemistry and Physics, vol. 12, pp. 4245–4258, 2012. ↩
- [54] The Guardian datablog, „Nuclear power plant accidents: listed and ranked since 1952“, The Guardian, 2011 (accessed 2017-07-20). ↩
Leave a Reply